|
student outcomes
> standardized test scores >
Academic Performance Indexes by Student Characteristics
(4 Charts)
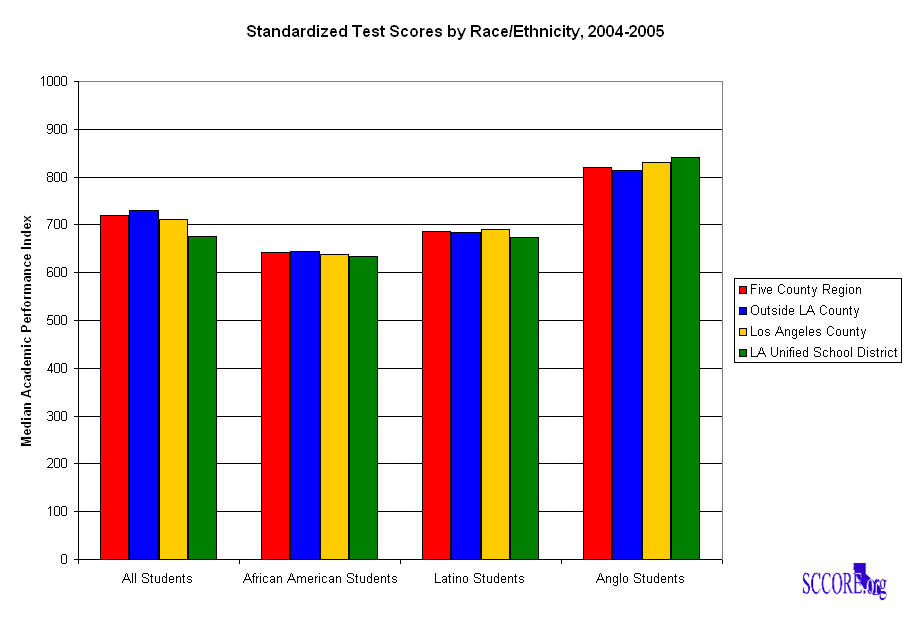
Race and ethnicity are powerful
predictors of Academic Performance Index scores.
(Chart 1 of 4)
Data Source: California Department of Education API Reports,
http://www.cde.ca.gov/ta/ac/ap/index.asp
- Academic Performance Index scores for Anglo students are
consistently higher than average API scores for each region.
- API scores for Latino and African American students are
consistently lower than average API scores for each region.
- API scores for Asian Pacific Islanders are hard to measure due to
the way the California presents its data.
Schools with higher proportions of
students who are poor tend to have lower Academic Performance Index
scores.
(Chart 2 of 4)
Data source: Ed-Data Compare Schools Reports,
http://www.ed-data.k12.ca.us/
Schools with higher proportions of
students who are minority tend to have lower Academic Performance
Index scores.
(Chart 3 of 4)
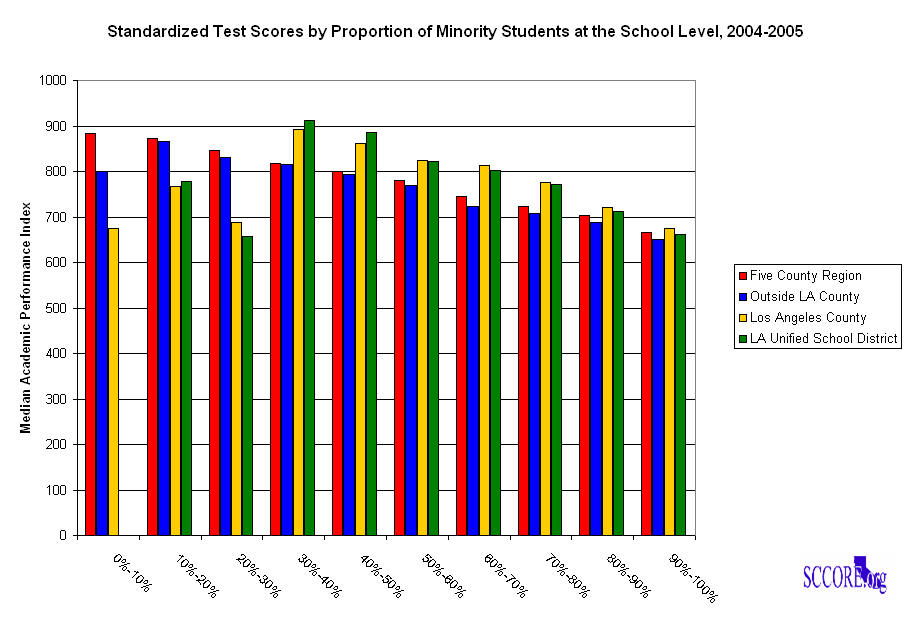
Data source: Ed-Data Compare Schools Reports,
http://www.ed-data.k12.ca.us/
- In schools where less than 20% of students are minorities, API
scores tend to be over 800.
- In schools where more than 80% of students are minorities, API
scores tend to be at or below 700.
- Note: the analysis in this section is based on the schools which
fully reported the relevant data.
Schools with higher proportions of
students designated non-English speaking tend to have lower Academic
Performance Index scores.
(Chart 4 of 4)
Data source: Ed-Data Compare Schools Reports,
http://www.ed-data.k12.ca.us/
- In schools where less than 20% of students are non-English
speaking, API scores consistently exceed 650.
- In schools where more than 80% of students are non-English
speaking, API scores are consistently below 650.
Last Updated:
May 24, 2006
|